56 Maps
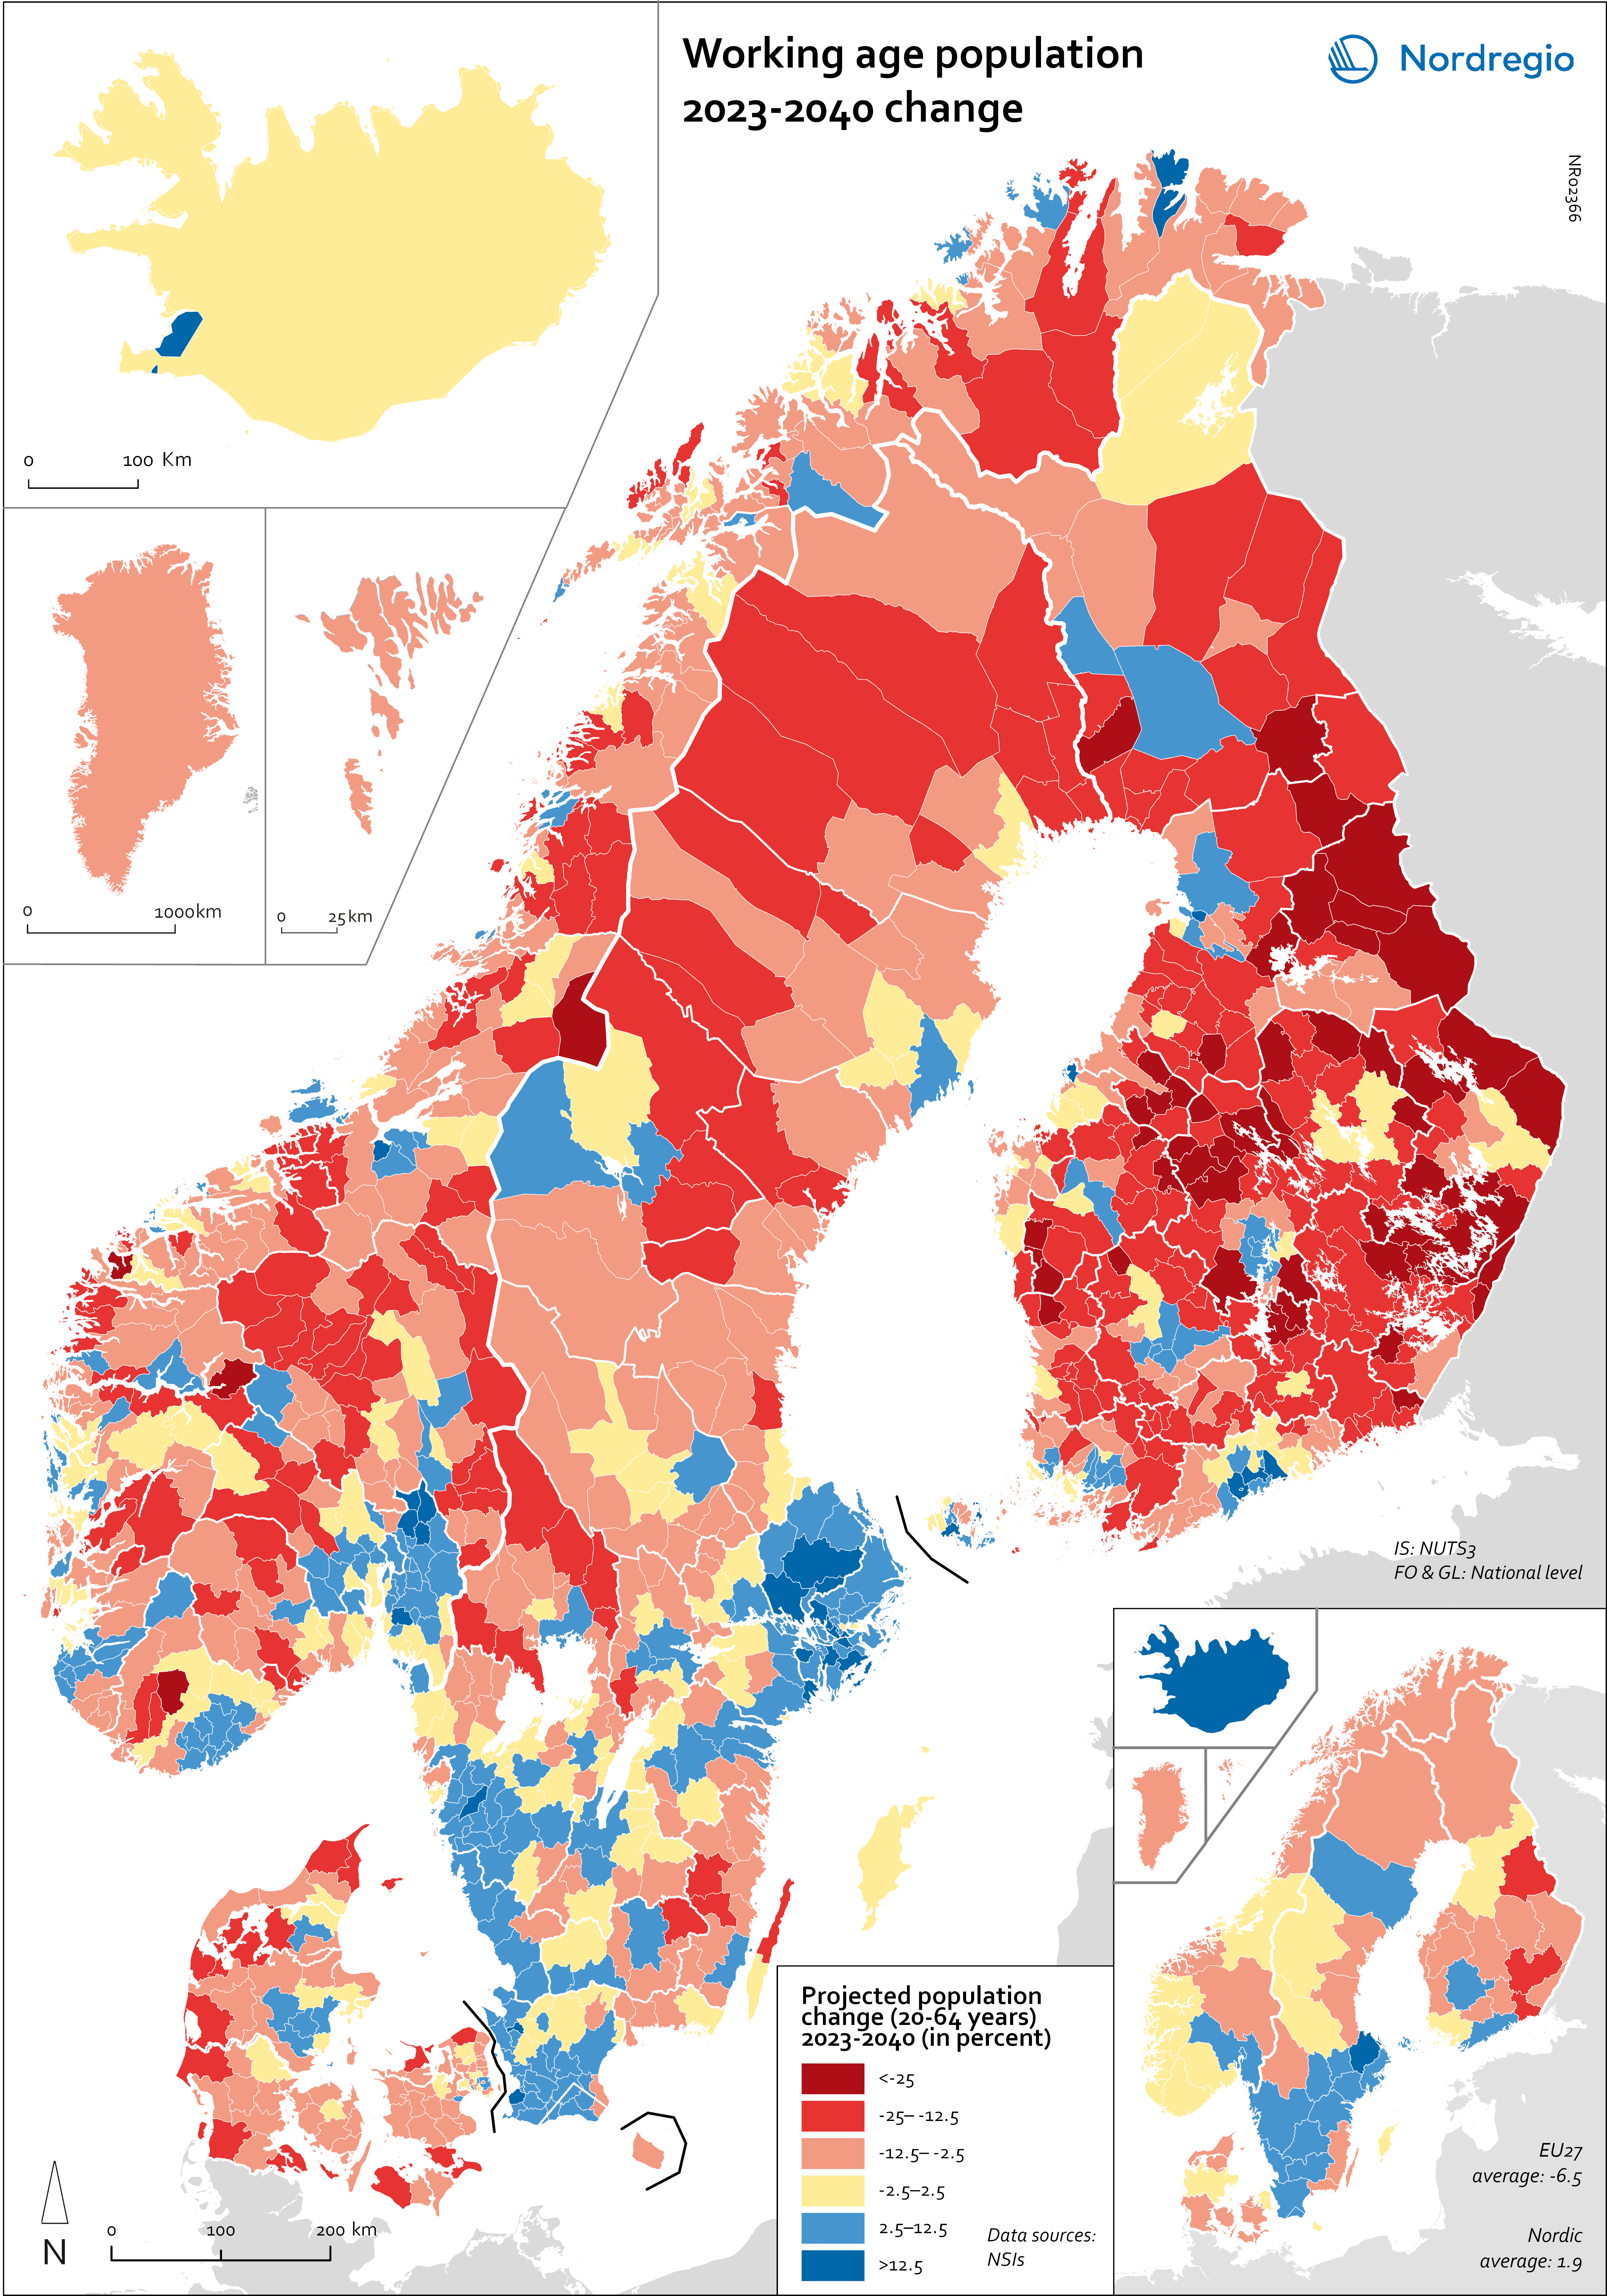
Working age population – 2023-2040 change
This map illustrates the projected change in the working-age population across Nordic municipalities (large map) and regions (small map) from 2023 to 2040. The working-age population is defined here as individuals aged 20 to 64. The blue areas on the maps represent municipalities and regions where the working-age population is expected to increase during this period. In contrast, the red areas indicate a projected decline in the working-age population. These projections are based on data from Nordic statistical institutes, though it’s important to note that the underlying assumptions may vary between Nordic countries. In most of the Western world, the working-age population is decreasing. In the EU, this age group is expected to decrease by 6.5% between 2023 and 2040. Only five EU countries – Malta, Luxembourg, Ireland, Sweden and Belgium – are expected to enjoy growth in the working-age population during this period. However, in the Nordic Region as a whole, the working-age population is expected to grow slightly, with an average increase of 1.9%. As the map shows, the distribution is quite varied, with considerable differences both between and within the countries. The biggest increase is expected in Iceland (28%), followed by Sweden (5.8%), Åland (3.9%) and Norway (0.6%). Decreases are expected in Finland (-0.5%), the Faroe Islands (-2.6%), Denmark (-3.2%) and Greenland (-11.4%). This development is in addition to the decreases already experienced by Finland since 2013. In general, the trend of growing populations in cities and decreasing populations in rural areas is expected to continue. The regions that are expected to have the highest working-age population growth include Höfuðborgarsvæðið in Iceland, Uppsala (+13%), Stockholm (+12%), Skåne (+9%), Halland (+7%) and Västra Götaland (+6%) in Sweden, Uusimaa (+8%) and Pirkanmaa (+5%) in Finland, and Oslo and Viken in Norway (+5%). In addition, Copenhagen municipality (+5%), Rødovre (+9%)…
 2025 April
 - Demography
- Labour force
- Nordic Region

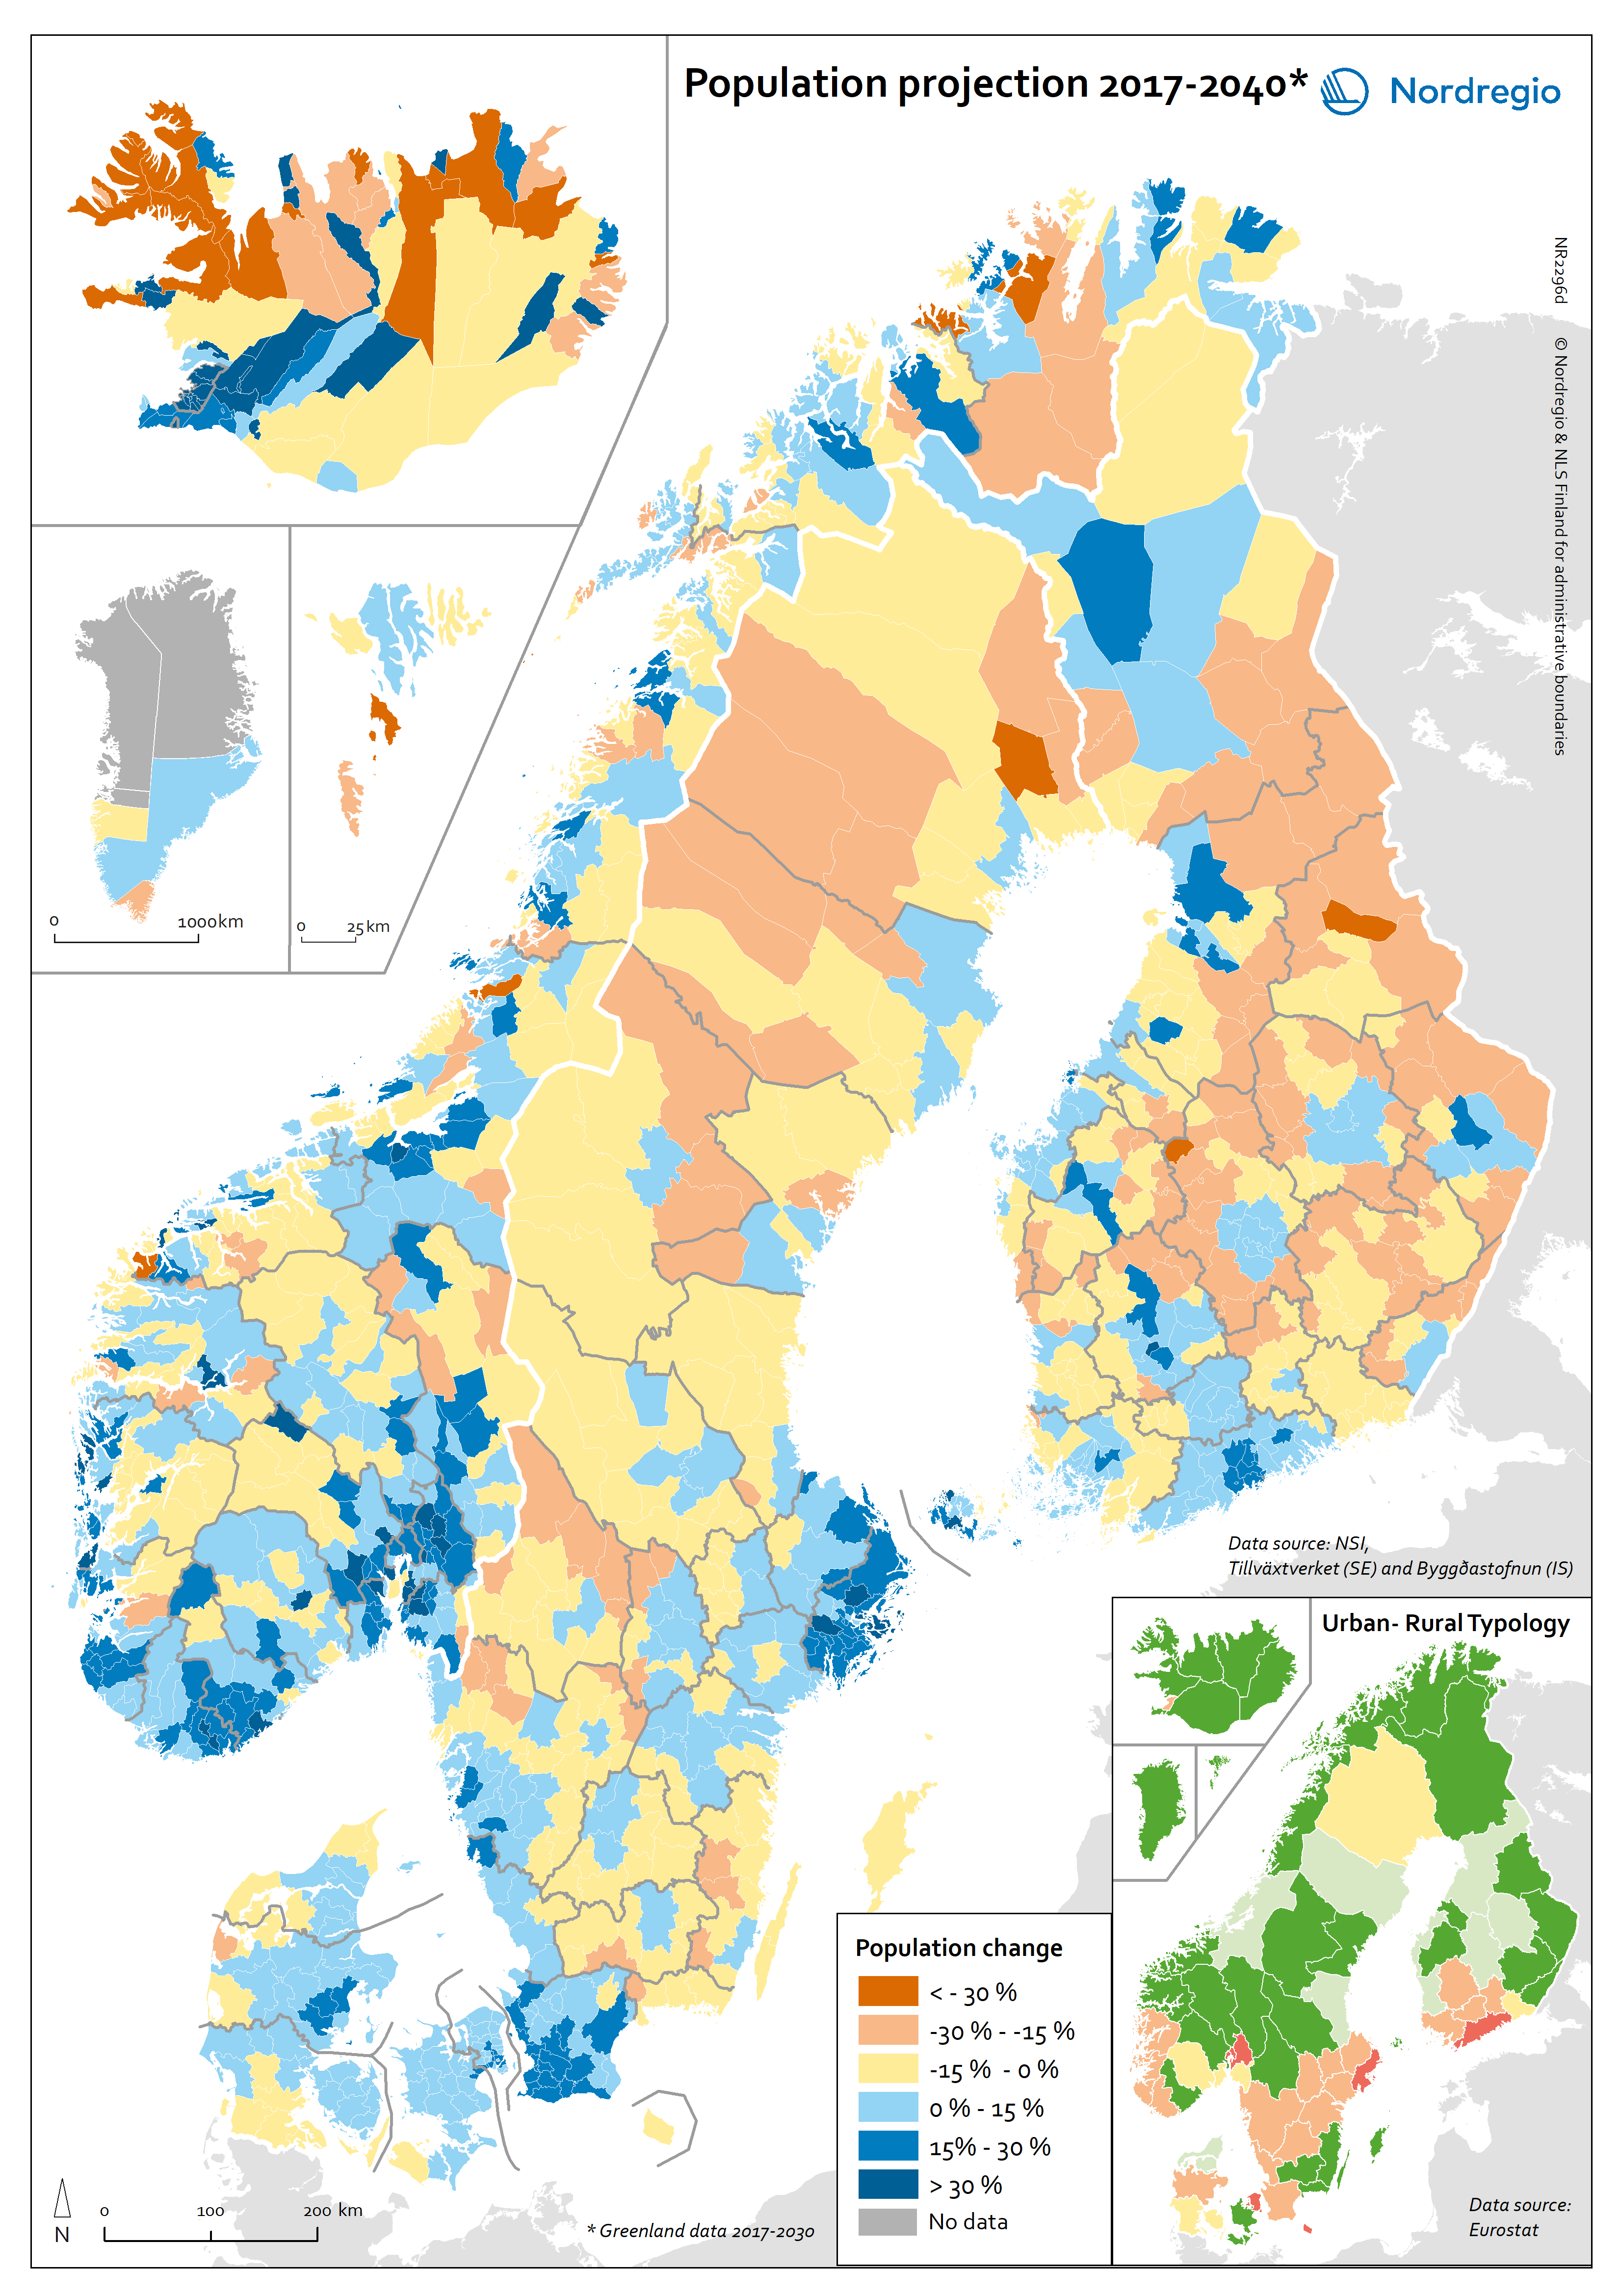
Population projection 2017-2040
This map shows the expected population change in Nordic municipalities by looking at the change between 2017 and 2040. The colours on the main map indicates the percentage of population change at municipal level between 2017 and 2040. Shades of red indicate a population decline, whereas shades of blue indicate a population increase. The colours on the regional map (bottom-right corner) indicates the type of region according to the Eurostat’s urban-rural typology (see: http://nordregio.org/maps/urban-rural-typology-of-nordic-regions/): shades of red indicate predominantly urban regions, yellow for intermediate regions and shades of green for predominantly rural regions. In the two types of regions classified as predominantly rural (“light green” and „dark green“ regions), population growth largely remains concentrated in larger towns and their suburbs. This is particularly the case in Sweden and Finland. For instance, the regional capitals Östersund in Jämtland (SE) and Seinäjoki in South Ostrobothnia (FI) are expected to have larger populations in 2040 than today, while most other municipalities in these regions will decline. In Norway and Iceland, a somewhat more nuanced pattern applies. Here population growth is not only expected in regional capitals and other larger towns, but also in some smaller and more remote municipalities. In Denmark, finally, population growth is expected for large parts of the country until 2040, in more rural and urban areas alike. Population loss is only expected in some of the most remote municipalities at the Northern, Eastern and Southern borders of the country. While the population loss in rural regions is hence expected to continue across the Nordic Region, it appears to be more pronounced in some countries than in others. In the predominantly urban (“red”) regions, the opposite pattern applies: With very few exceptions, municipalities in these regions are expected to experience a growth in population numbers until 2040.
- 2020 September
- Demography
- Nordic Region

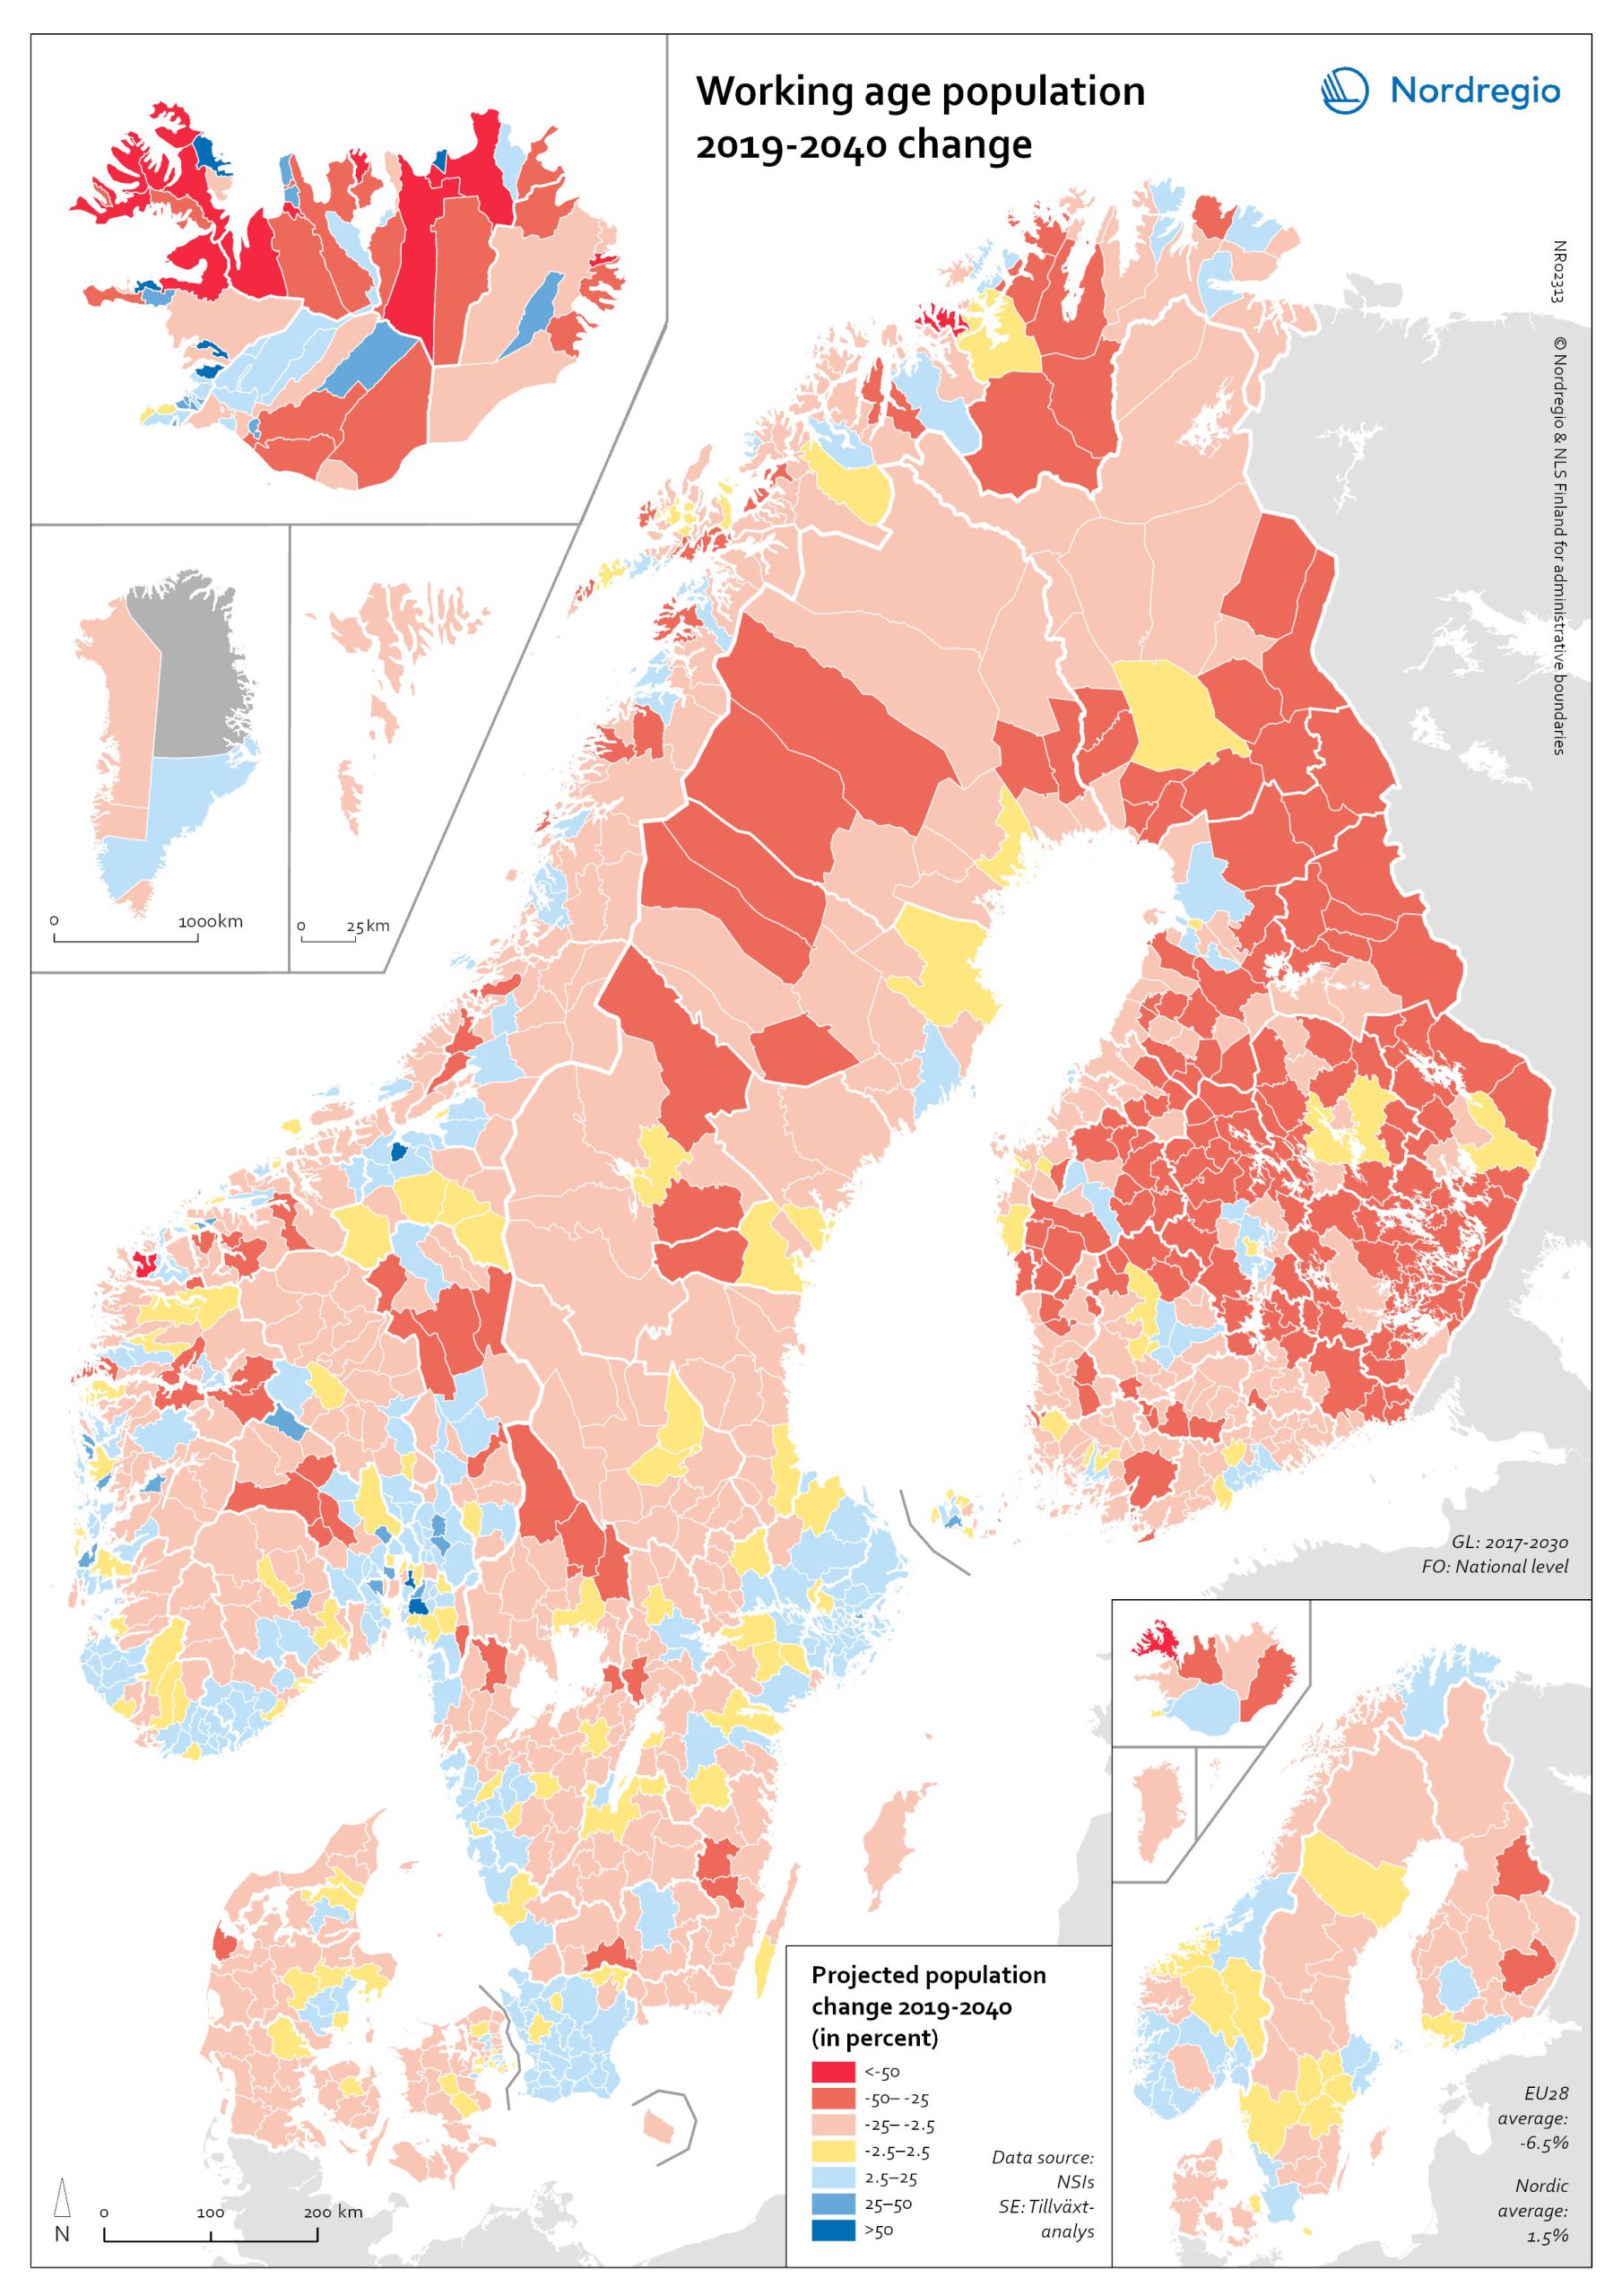
Change in working age population 2019-2040
This map shows the projected working age population change at municipal level during the period 2019-2040 While the total population of the Nordic Region is projected to grow by 8% to 29.5 million by 2040, the growth of the working-age population (15–64 years) is expected to be more modest at 1.5%. The working-age population also referred to as the potential labour supply, refers to all people in the population aged 15–64 years. It is a potential supply because it includes all those who fit the age requirement, despite some not actually being available for the labour market (e.g. full-time students, those with long-term illnesses or disabilities that affect their ability to work). The potential labour supply at the local level is constantly shifting due to trends such as ageing, migration and urbanisation. The red areas on the map indicate a projected working-age population decline and blue areas an increase. The yellow areas indicate a stable development. On a national level Greenland (-16.2%), the Faroe Islands (-6.6%), Finland (-3%) and Denmark (-2%) are projected to see a decrease in the working-age population, while increases are projected in Sweden (4%), Norway (4.6%), Åland (9.1%) and Iceland (10.9%). It is worth noting that, even in the parts of the Nordic Region where the working-age population is expected to shrink, the projections are less severe than the EU28 average (-6.5%). Greenland and Faroe Islands are the only exceptions. At the municipal level, the variation is even more striking with the majority (72%) of Nordic municipalities projected to experience a decrease in the size of the working-age population. As Figure 6.2 shows, this trend is most pronounced in Finland (decline of the working-age population in 90% of the municipalities) and Denmark (81%) and less apparent in Sweden (67%), Iceland (64%) and Norway (61%). Most of…
- 2020 February
- Demography
- Labour force
- Migration
- Nordic Region
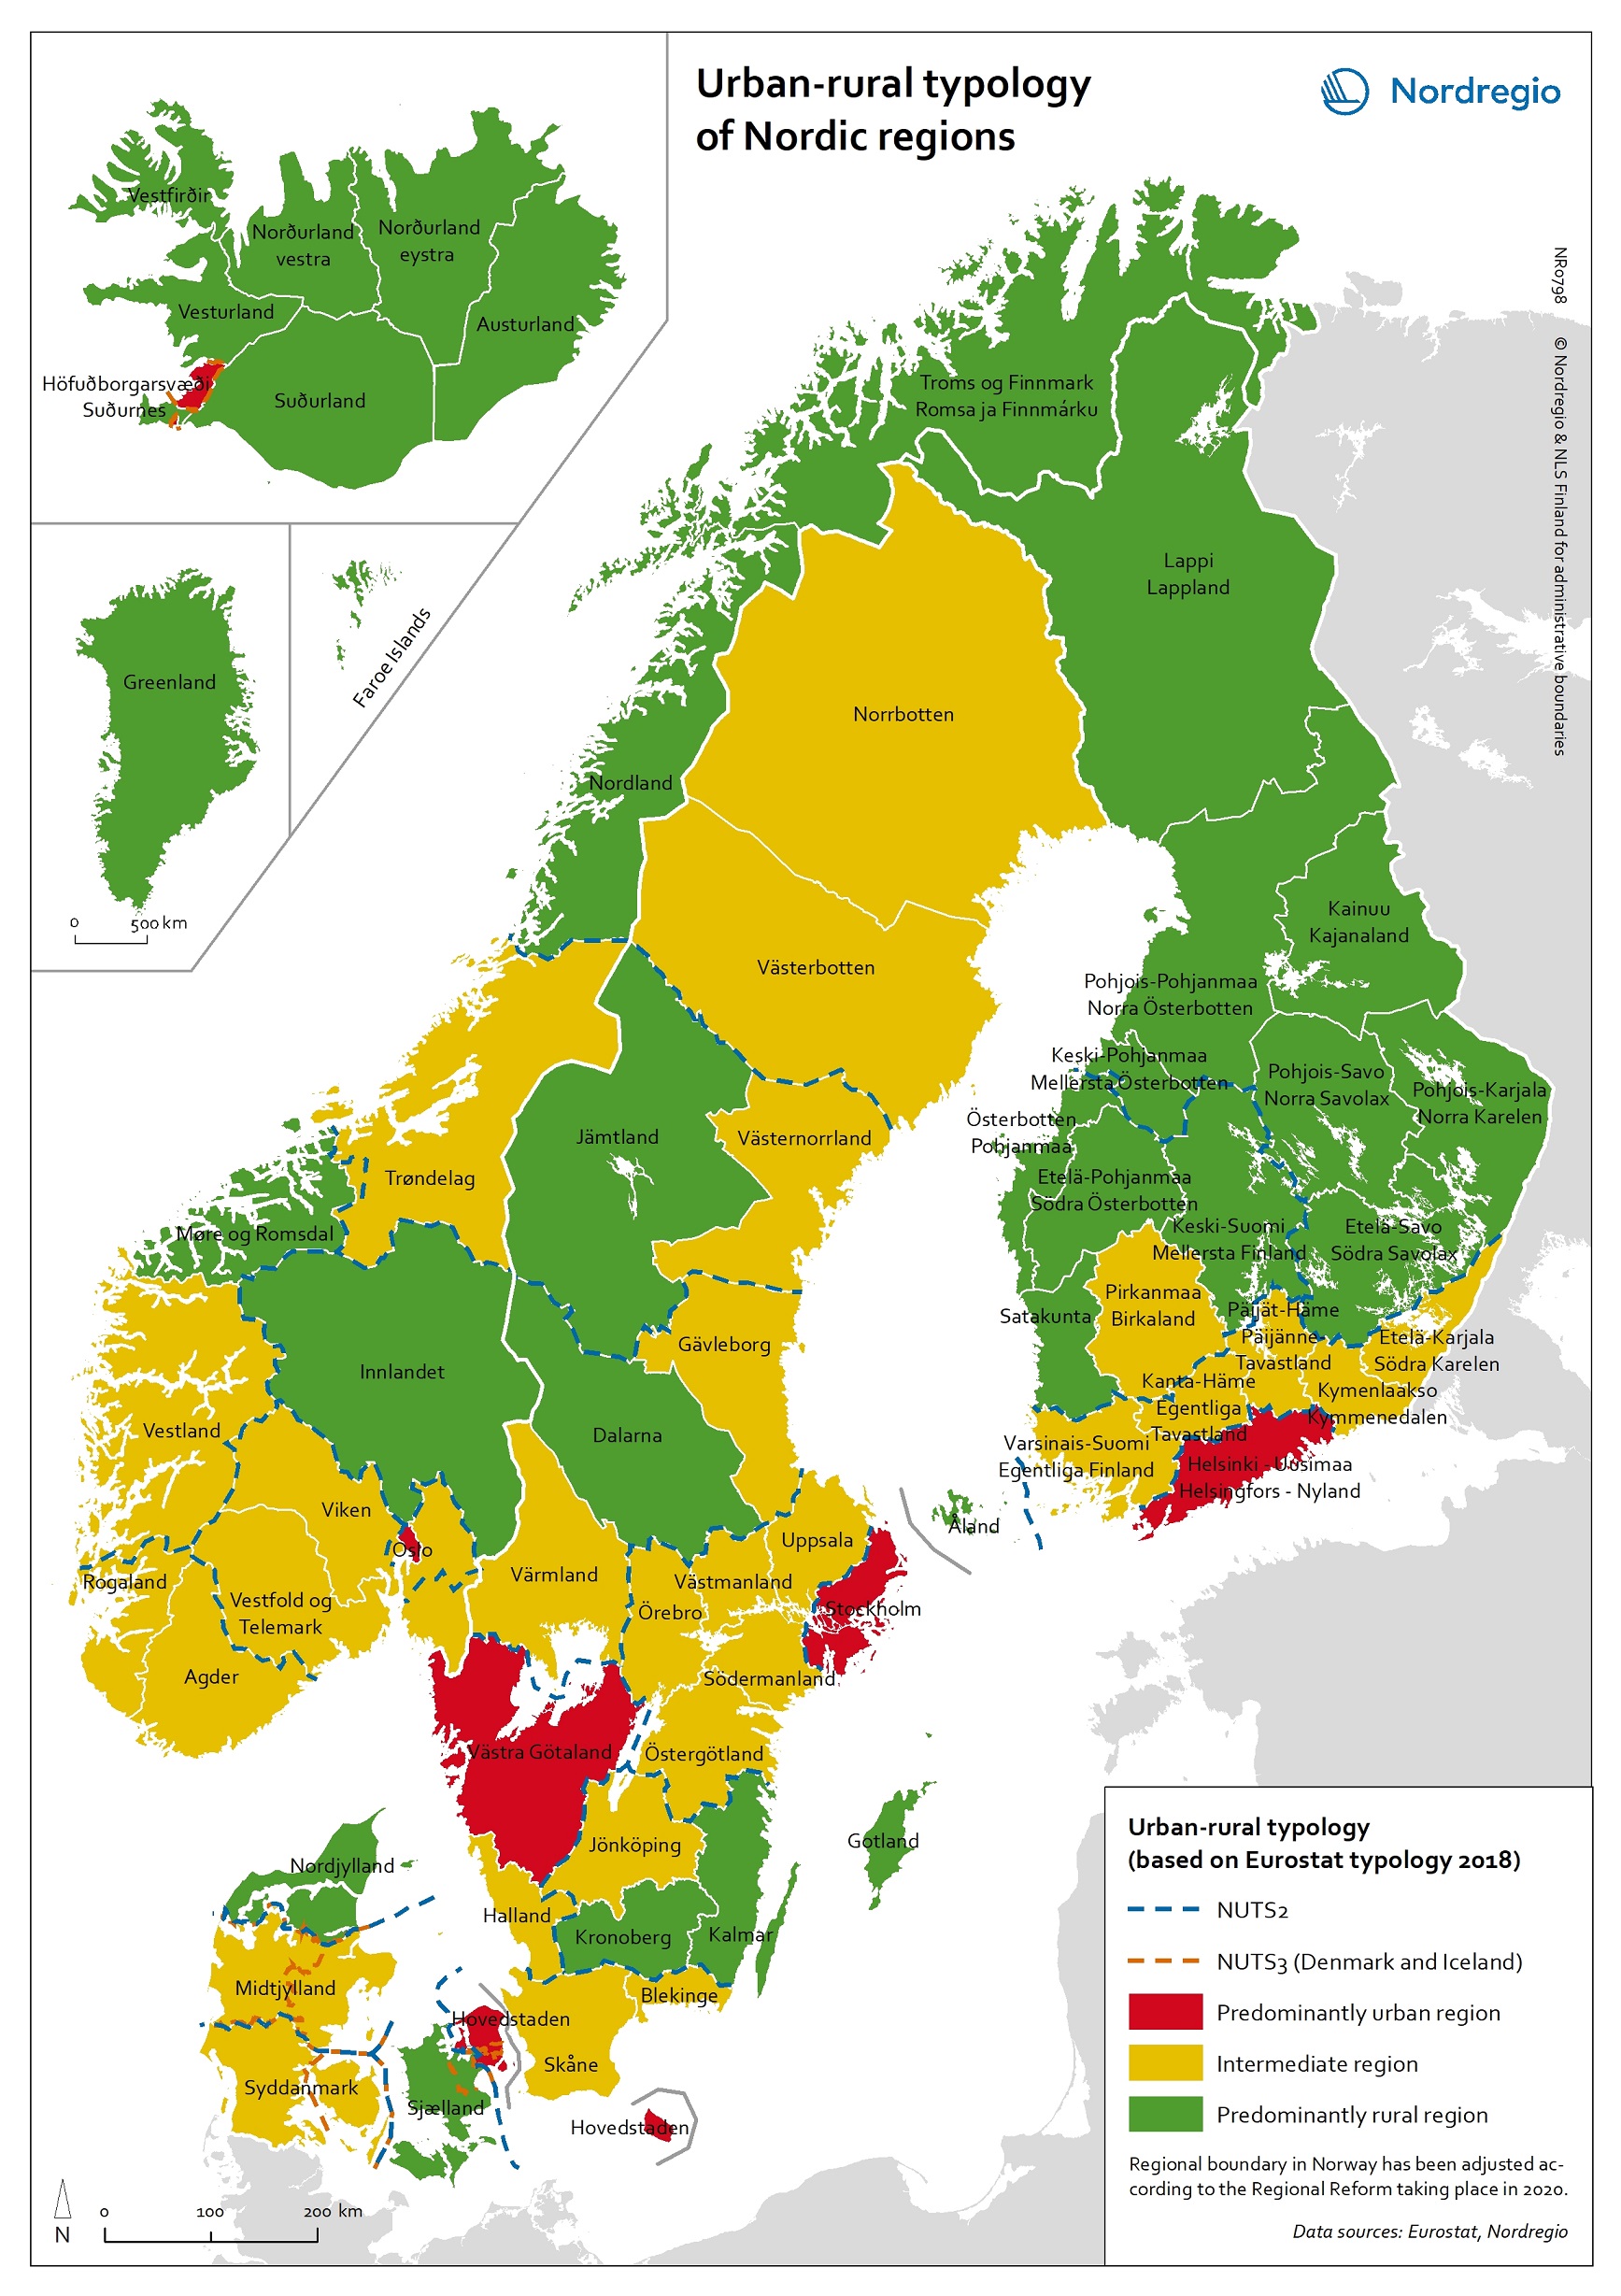
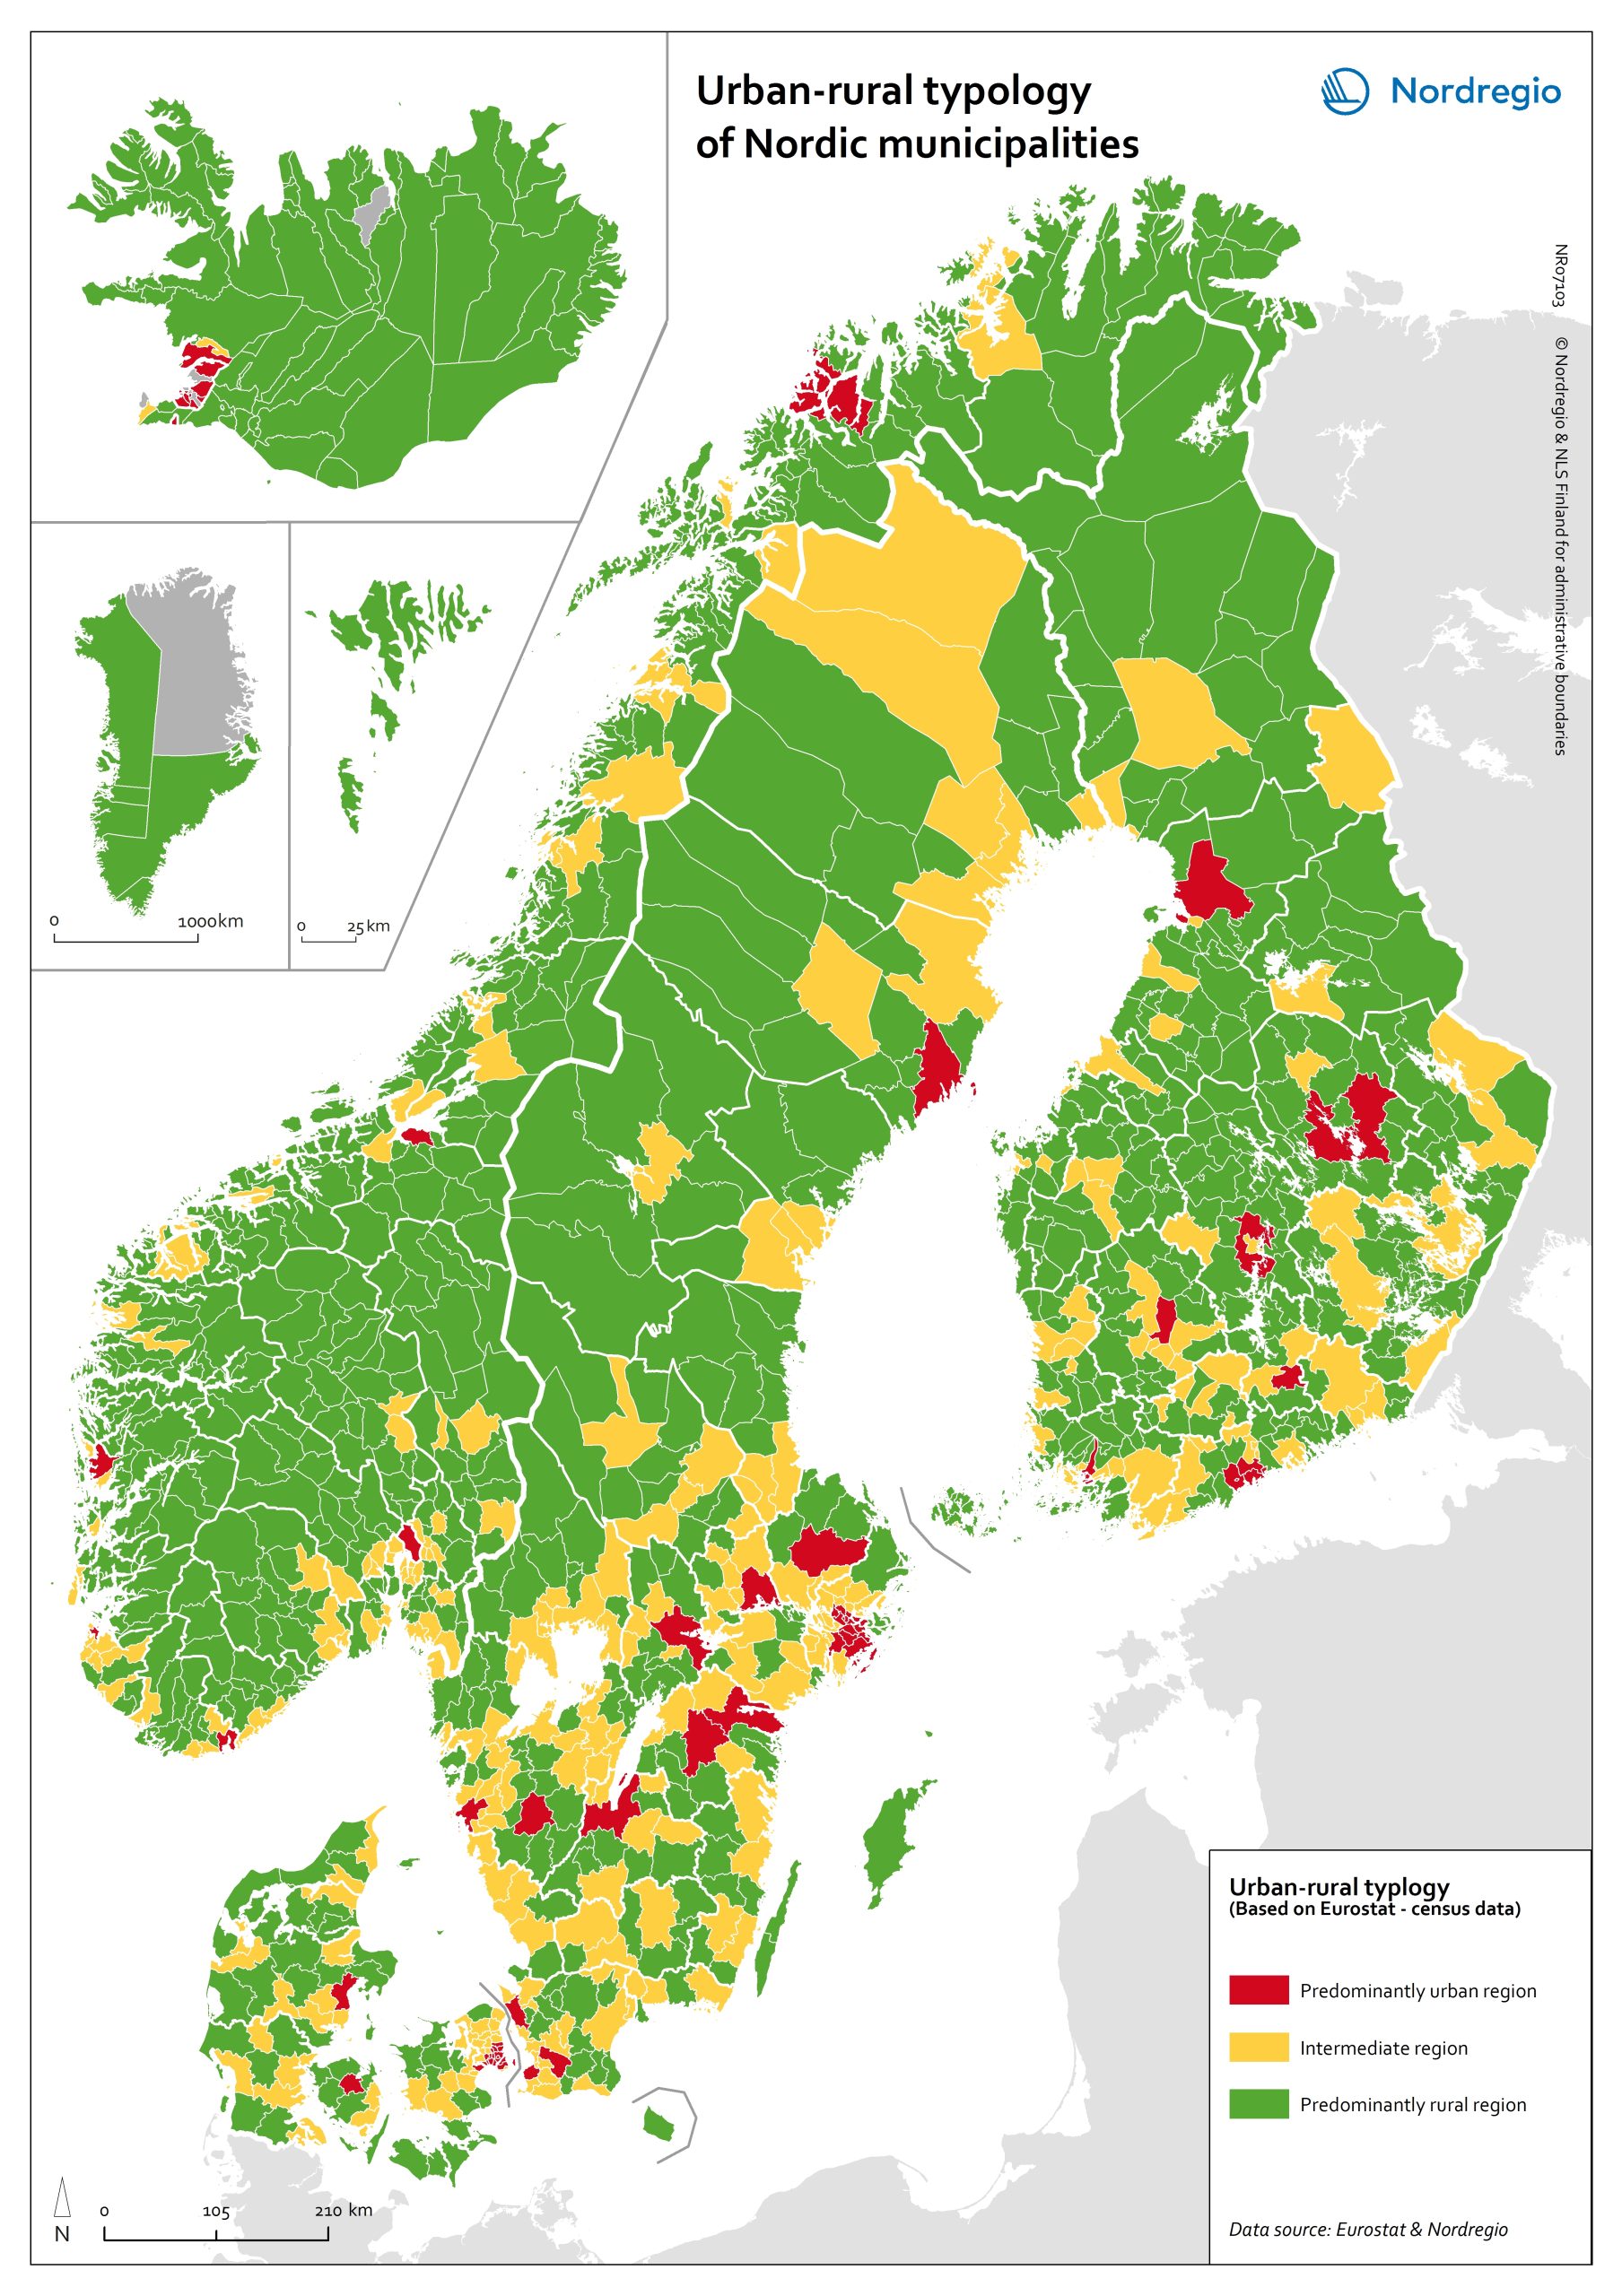
Urban-rural typology of the Nordic regions 2020
This map is included in the introduction of the State of the Nordic Region 2020 report. The map is based on the typology provided by Eurostat (2018), in which the 2016 NUTS 3 regions are classified in three categories according to their population density in 2011 and 2015, in 1 km² grids. In predominantly urban regions, at least 80% of the total population is urban, while in intermediate regions, 50–80% of the population lives in urban clusters. In regions that are predominantly rural, less than 50% of the population lives in urban areas. Read the digital publication here.
- 2020 February
- Administrative and functional divisions
- Demography
- Nordic Region

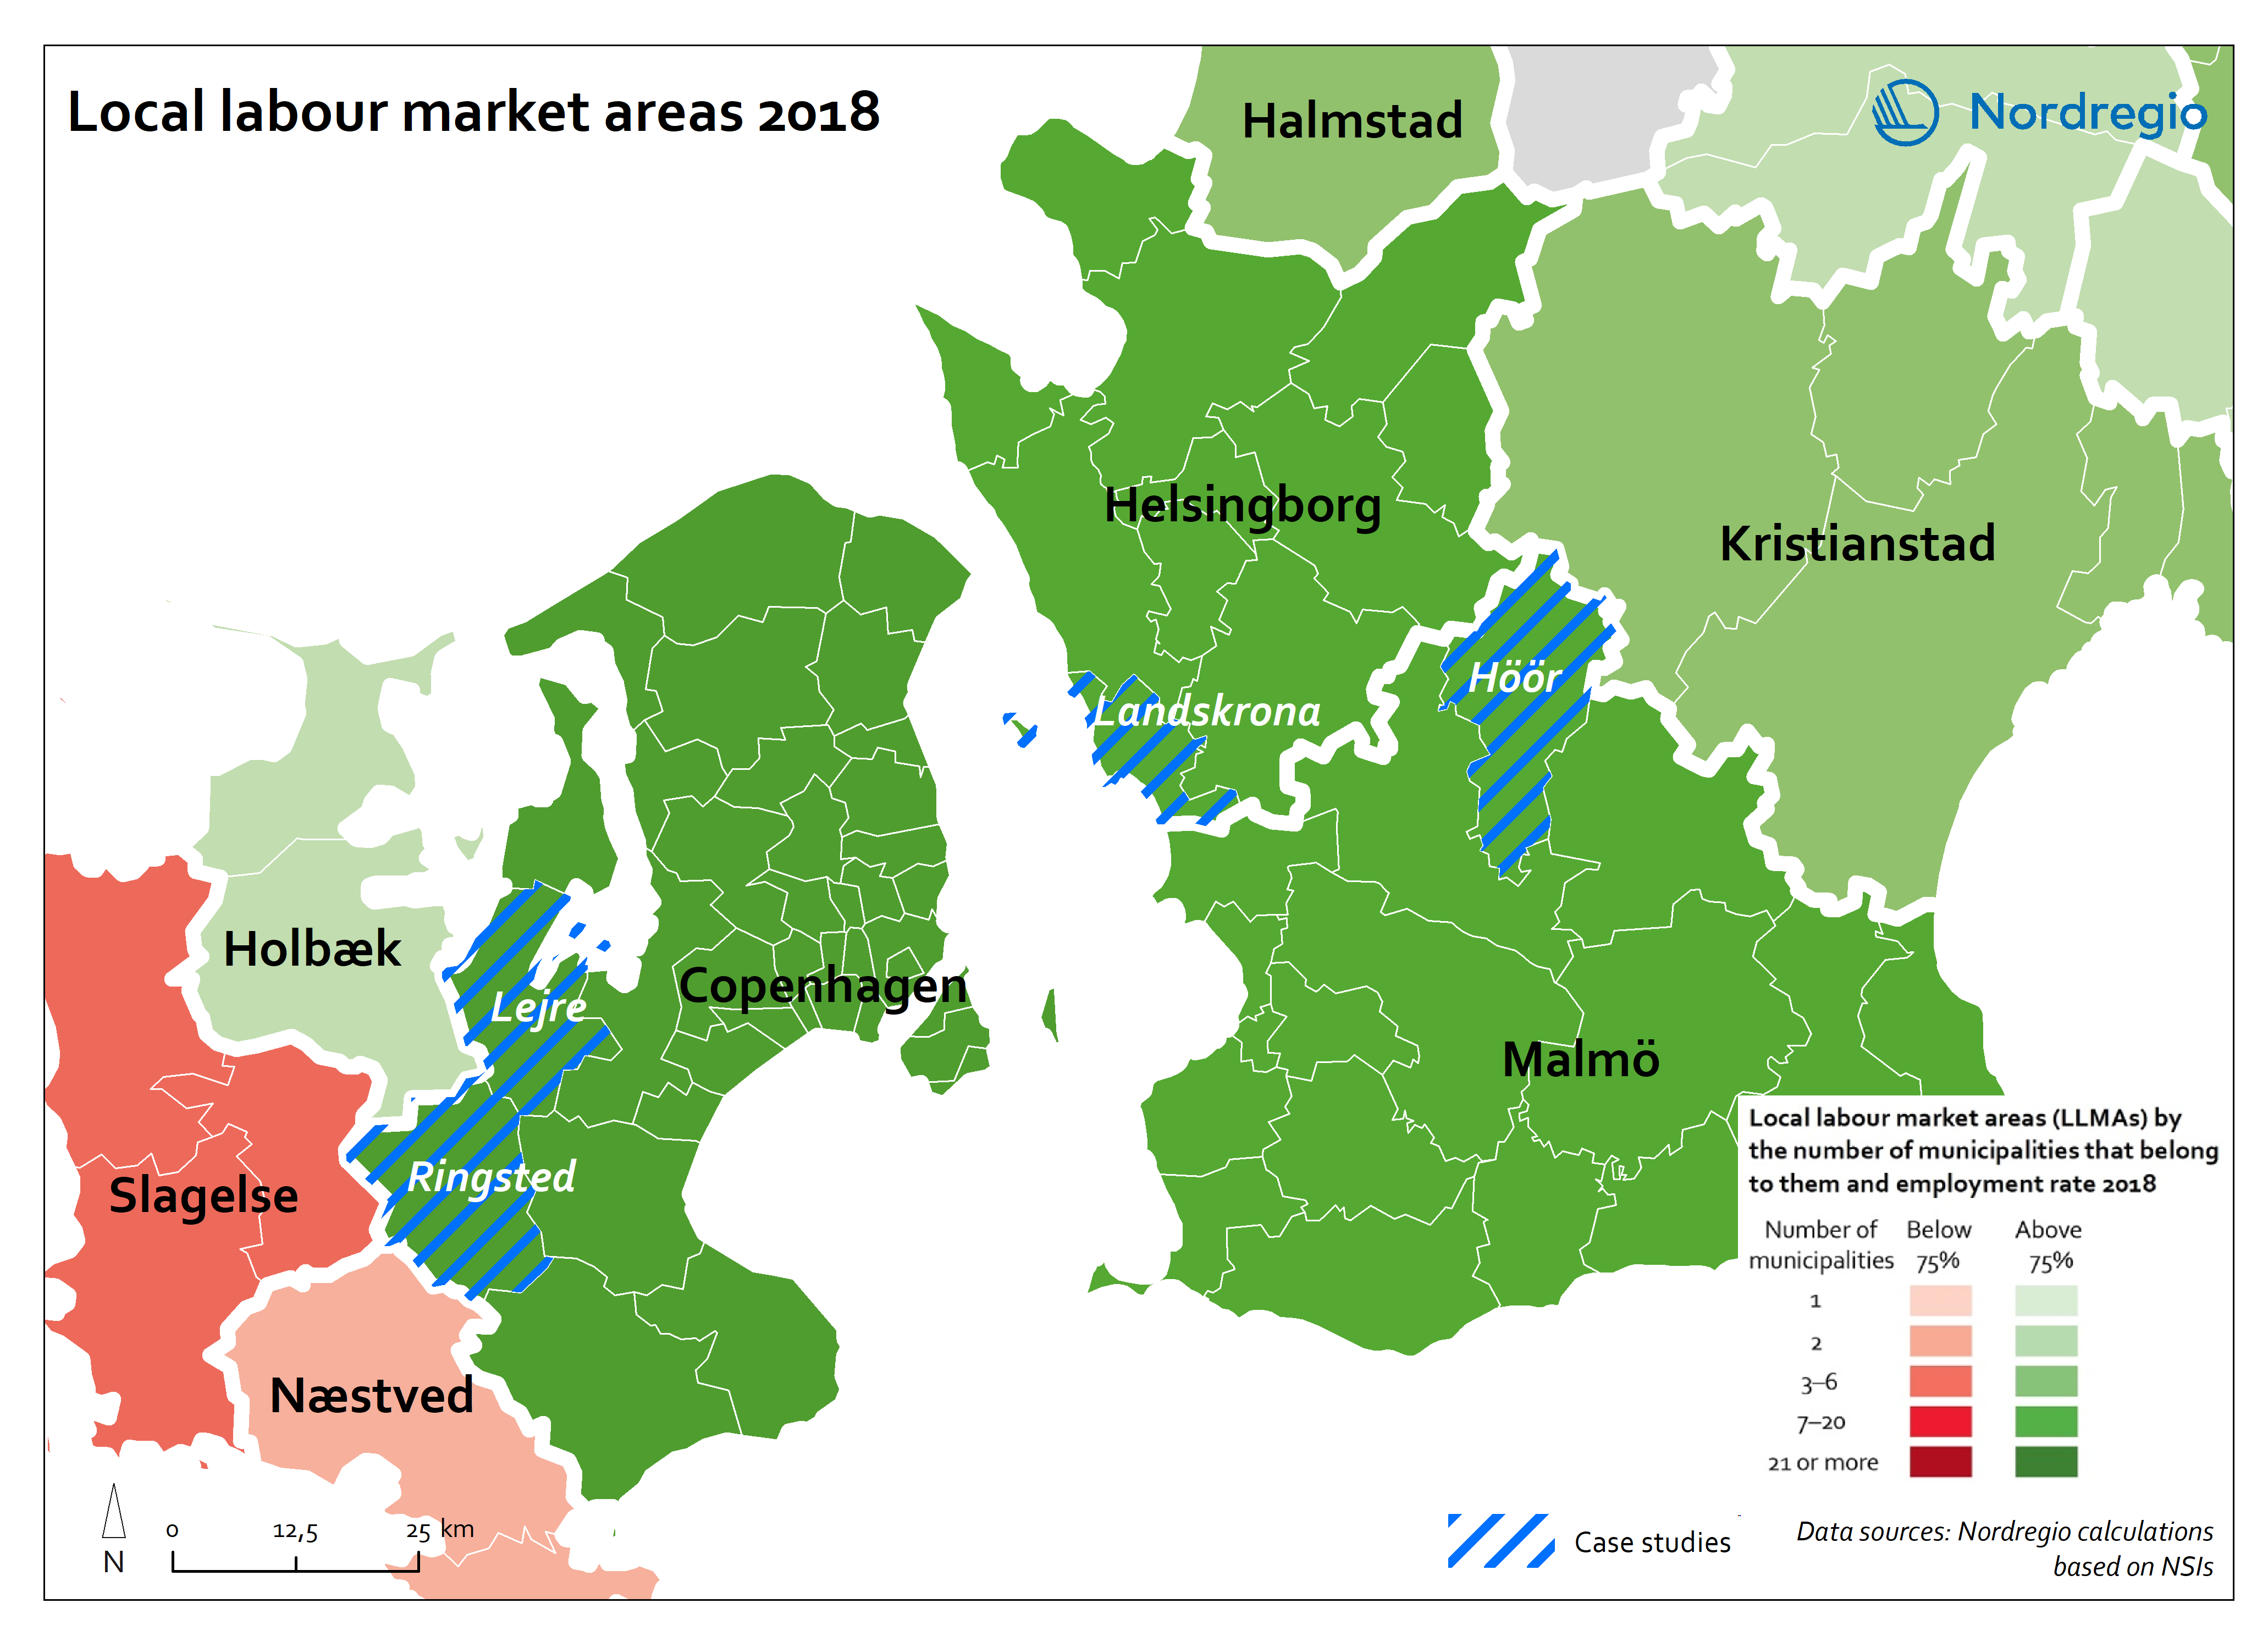
Municipalities by degree of urbanisation and functional urban areas
This map shows Nordic municipalities differentiated between their degree of urbanisation. The degree of urbanisation is the relationship between the population living in urban (and rural) areas and the total population of the municipality. The degree of urbanisation is a difficult concept to display but is useful as a way of adding nuance to the debate on urban-rural relations. The map also displays the functional urban areas in the Nordic Region. Cities with at least 50% of the population living in high-density clusters are highlighted in red. Towns and suburbs with less than 50% of the population living in high-density clusters and in rural areas are highlighted in dark blue. Rural areas with more than 50% of the population living in rural areas are highlighted in light blue. Functional urban areas are circled in black. The core cities of the 31 urban functional areas in the Nordic Region correspond to the cities as defined by degree of urbanisation. In the functional urban areas of Esbjerg and Aalborg in Denmark, for instance, there are however no densely populated urban centres. The hinterlands in most functional urban areas in the Nordic Region do include towns and suburbs as well as rural areas. Moreover, municipalities in sparsely populated areas can display a high degree of urbanisation, such as, for example, Kiruna and Gällivare in Sweden. The map is based on data from the Joint Research Center, the OECD Eurostat and EC-DG Region 2011 and 2014. In Iceland, the FUA Reykjavik is represented by NUTS-2 region IS001/Capital region.
- 2018 February
- Administrative and functional divisions
- Nordic Region
